
반응형
Notice
Recent Posts
Recent Comments
Link
| 일 | 월 | 화 | 수 | 목 | 금 | 토 |
|---|---|---|---|---|---|---|
| 1 | 2 | 3 | 4 | 5 | 6 | 7 |
| 8 | 9 | 10 | 11 | 12 | 13 | 14 |
| 15 | 16 | 17 | 18 | 19 | 20 | 21 |
| 22 | 23 | 24 | 25 | 26 | 27 | 28 |
| 29 | 30 | 31 |
Tags
- vue 컴포저블 함수
- commonjs와 ecmascript modules(esm)
- firebase id 자동
- d3 지도
- 이미지 성능 최적화
- vue3 drag and drop
- 함수형 프로그래밍
- vue draggable 차트 안나옴
- pm2 버전 충돌
- in-memory pm2 is out-of-date
- img 태그 srcset
- Learning React
- git
- img 태그 sizes
- reflow
- d3 지도 확대/축소
- ToDo
- vuedraggable
- d3 지도 타입스크립트
- $fetch
- component is already mounted please use $fetch instead.
- 헌혈유공패 은장
- vue composable 함수
- d3 지도 툴팁
- 웹 퍼포먼스 도구
- 인터넷 거버넌스
- nuxt universal rendering
- pm2 업데이트 에러
- repaint
- cloud firestore id auto increment
Archives
- Today
- Total
빵 입니다.
Chart.js 툴팁 레이블 색상 변경, 레전드 레이블 색상 변경 본문
반응형
라인 차트를 사용하는데, 기본적으로 흐린 라인이었다가 포커스가 가면 Point Dot과 라인에 색상이 입혀지는 디자인이 나왔다.
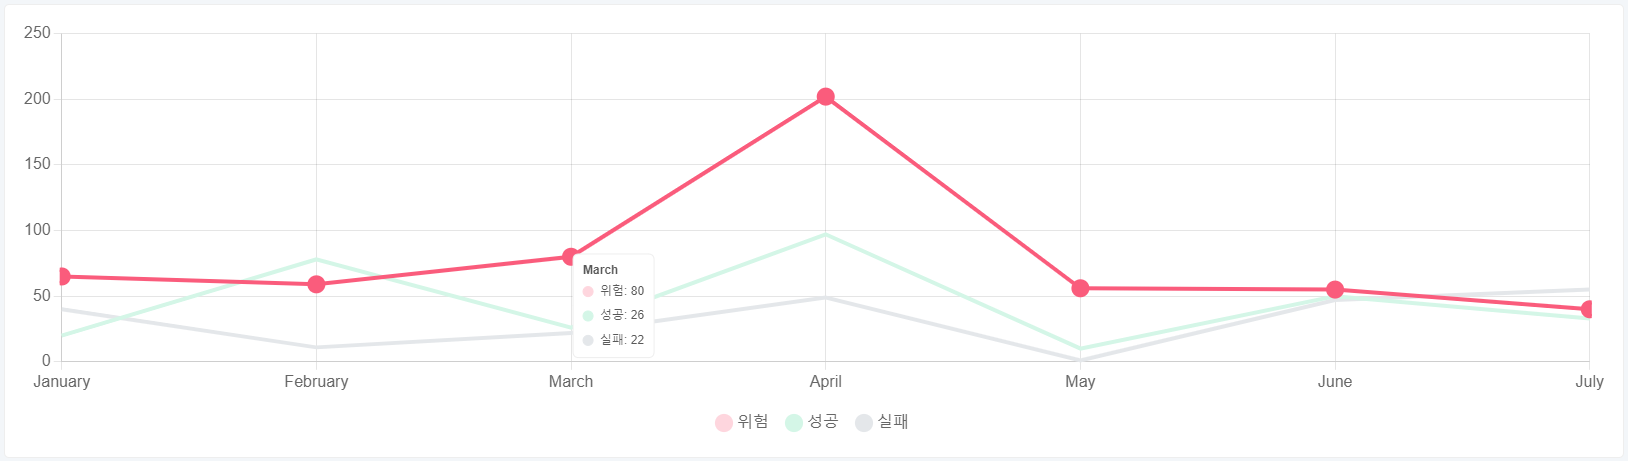
어찌저찌 레퍼런스에서 라인 색상 hover 전, 후를 대응하는 속성값들을 찾아서 적용했는데,
아무리 찾아도 툴팁 레이블 색상과 레전드의 레이블 색상을 변경하는 방법을 모르겠더라.
그래도 똑같이 구현하고 싶고, 또 전혀 없을 것 같은 내용은 아니라 열심히 찾아보았다.
역시나 없을리가 없지~
다른 분들의 시간 절약을 위해 공유해 보겠습니다.
우선, 차트 마우스오버 효과를 주기 위한 설정값들입니다.
import { type ChartData } from 'chart.js'

const lineChartData = reactive<ChartData<'line', number[], unknown>>({
  labels: ['January', 'February', 'March', 'April', 'May', 'June', 'July'],
  datasets: [
    {
      label: '위험',
      data: [65, 59, 80, 202, 56, 55, 40],
      // line
      borderColor: '#fed6de',
      hoverBorderColor: '#fa5c7c',
      borderWidth: 4,
      hoverBorderWidth: 4,
      // point
      pointRadius: 0,
      pointHoverRadius: 7,
      pointBorderColor: '#fed6de',
      pointHoverBorderColor: '#fa5c7c',
      backgroundColor: '#fed6de',
      hoverBackgroundColor: '#fa5c7c'
    },
    {
      label: '성공',
      data: [20, 78, 26, 97, 10, 50, 33],
      // line
      borderColor: '#d4f6e7',
      hoverBorderColor: '#53dca0',
      borderWidth: 4,
      hoverBorderWidth: 4,
      // point
      pointRadius: 0,
      pointHoverRadius: 7,
      pointBorderColor: '#d4f6e7',
      pointHoverBorderColor: '#53dca0',
      backgroundColor: '#d4f6e7',
      hoverBackgroundColor: '#53dca0'
    },
    {
      label: '실패',
      data: [40, 11, 22, 49, 1, 47, 55],
      // line
      borderColor: '#e4e7ea',
      hoverBorderColor: '#959faa',
      borderWidth: 4,
      hoverBorderWidth: 4,
      // point
      pointRadius: 0,
      pointHoverRadius: 7,
      pointBorderColor: '#e4e7ea',
      pointHoverBorderColor: '#959faa',
      backgroundColor: '#e4e7ea',
      hoverBackgroundColor: '#959faa'
    }
  ]
})
아래 내용은 옵션값인데요.
import { Line } from 'vue-chartjs'
import { Chart, type ChartData } from 'chart.js'

const options = reactive({
  type: 'chart',
  responsive: true,
  maintainAspectRatio: false,
  interaction: {
    intersect: false,
    mode: 'index'
  },
  hover: {
    mode: 'dataset'  // 마우스 오버 효과를 위해 꼭 필요
  },
  plugins: {
    legend: {
      display: true,
      position: 'bottom',
      labels: {
        padding: 20,
        usePointStyle: true,
        pointStyle: 'circle',
        boxWidth: 10,
        boxHeight: 10,
        font: {
          size: 16
        },
        // 레전드 내 레이블 색상 변경
        generateLabels: (chart) => {
          const labels = Chart.defaults.plugins.legend.labels.generateLabels(chart)
          for (const key in labels) {
            const target = Number(key)
            if (target === 0) {
              labels[key].text = '위험'
              labels[key].fillStyle = '#fa5c7c'
              labels[key].strokeStyle = '#fa5c7c'
            } else if (target === 1) {
              labels[key].text = '성공'
              labels[key].fillStyle = '#53dca0'
              labels[key].strokeStyle = '#53dca0'
            } else if (target === 2) {
              labels[key].text = '실패'
              labels[key].fillStyle = '#959faa'
              labels[key].strokeStyle = '#959faa'
            }
          }
          return labels
        }
      }
    },
    tooltip: {
      borderWidth: 1,
      borderColor: '#eeeeee',
      backgroundColor: '#ffffff',
      padding: 10,
      bodySpacing: 10,
      titleColor: '#595959',
      usePointStyle: true,
      pointStyle: 'circle',
      boxPadding: 5,
      boxWidth: 10,
      boxHeight: 10,
      bodyColor: '#595959',
      font: {
        size: 12
      },
      caretSize: 0,
      // 툴팁 내 레이블 색상 변경
      callbacks: {
        labelColor: (tooltipItem) => {
          if (tooltipItem.datasetIndex === 0) {
            return {
              borderColor: '#fa5c7c',
              backgroundColor: '#fa5c7c'
            }
          }
          if (tooltipItem.datasetIndex === 1) {
            return {
              borderColor: '#53dca0',
              backgroundColor: '#53dca0'
            }
          }
          if (tooltipItem.datasetIndex === 2) {
            return {
              borderColor: '#959faa',
              backgroundColor: '#959faa'
            }
          }
        }
      }
    }
  },
  scales: {
    x: {
      ticks: {
        font: {
          size: 16
        }
      }
    },
    y: {
      ticks: {
        font: {
          size: 16
        }
      }
    }
  }
})
주목해야 할 내용 세가지는
1. 마우스 오버 효과를 주려면 후버 모드를 'dataset'으로 선언해 주어야 합니다.
options.hover.mode
hover: {
	mode: 'dataset' // 마우스 오버 효과를 위해 꼭 필요
},
2. 레전드 옵션의 generateLabels 함수를 이용해 레전드 내의 레이블 값 속성을 재선언해 주어야 합니다.
options.plugins.legend.labels
generateLabels: (chart) => {
    const labels = Chart.defaults.plugins.legend.labels.generateLabels(chart)
    for (const key in labels) {
        const target = Number(key)
        if (target === 0) {
          labels[key].text = '위험'
          labels[key].fillStyle = '#fa5c7c'
          labels[key].strokeStyle = '#fa5c7c'
        } else if (target === 1) {
          labels[key].text = '성공'
          labels[key].fillStyle = '#53dca0'
          labels[key].strokeStyle = '#53dca0'
        } else if (target === 2) {
          labels[key].text = '실패'
          labels[key].fillStyle = '#959faa'
          labels[key].strokeStyle = '#959faa'
        }
    }
    return labels
}
3. 툴팁 옵션의 callbacks로 제공하는 labelColor 함수를 이용해 툴팁 레이블 속성을 재선언 해주어야 합니다.
options.plugins.tooltip.callbacks
callbacks: {
    labelColor: (tooltipItem) => {
        if (tooltipItem.datasetIndex === 0) {
            return {
                borderColor: '#fa5c7c',
                backgroundColor: '#fa5c7c'
            }
        }
        if (tooltipItem.datasetIndex === 1) {
            return {
                borderColor: '#53dca0',
                backgroundColor: '#53dca0'
            }
        }
        if (tooltipItem.datasetIndex === 2) {
            return {
                borderColor: '#959faa',
                backgroundColor: '#959faa'
            }
        }
    }
}
그리고 결과 화면!
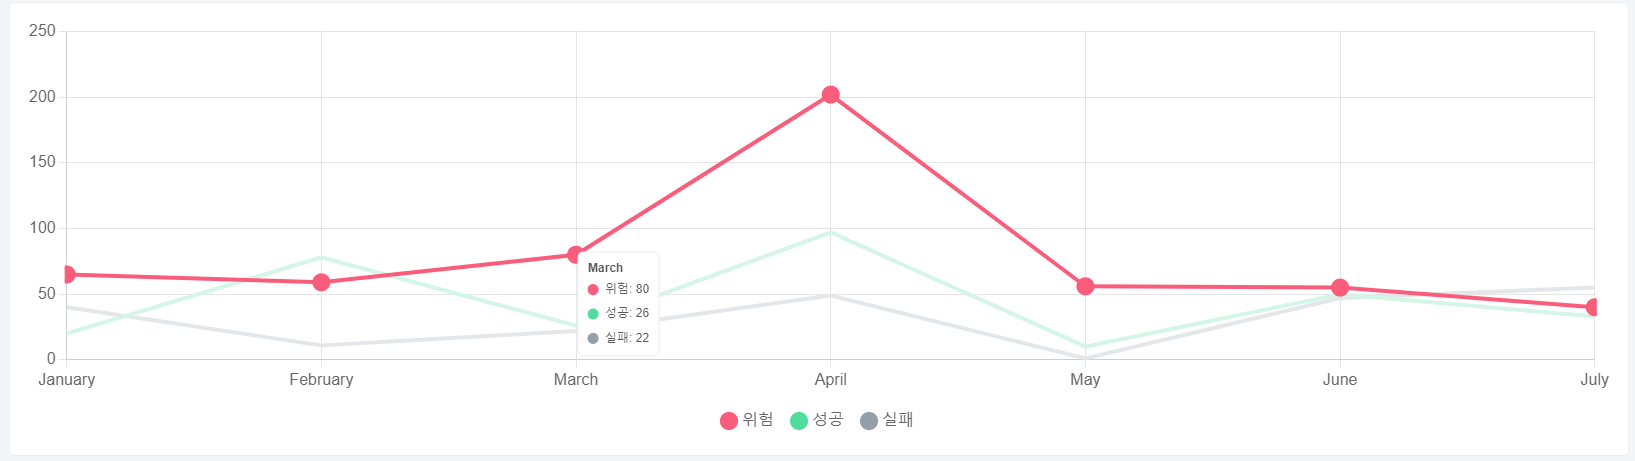
반응형
'프론트엔드 > Vue' 카테고리의 다른 글
| D3.js 지도 그리기(w/ 확대ㆍ축소 기능과 툴팁) (0) | 2025.03.11 |
|---|---|
| 참조형 props의 default 값 설정하기 (0) | 2025.01.16 |
| Chart.js 축 font-size 조절 (0) | 2024.07.30 |
| 화면별 권한 설정 (0) | 2024.03.04 |
| [Vue warn]: inject() can only be used inside setup() or functional components. (0) | 2024.02.26 |
'프론트엔드/Vue' Related Articles
more
